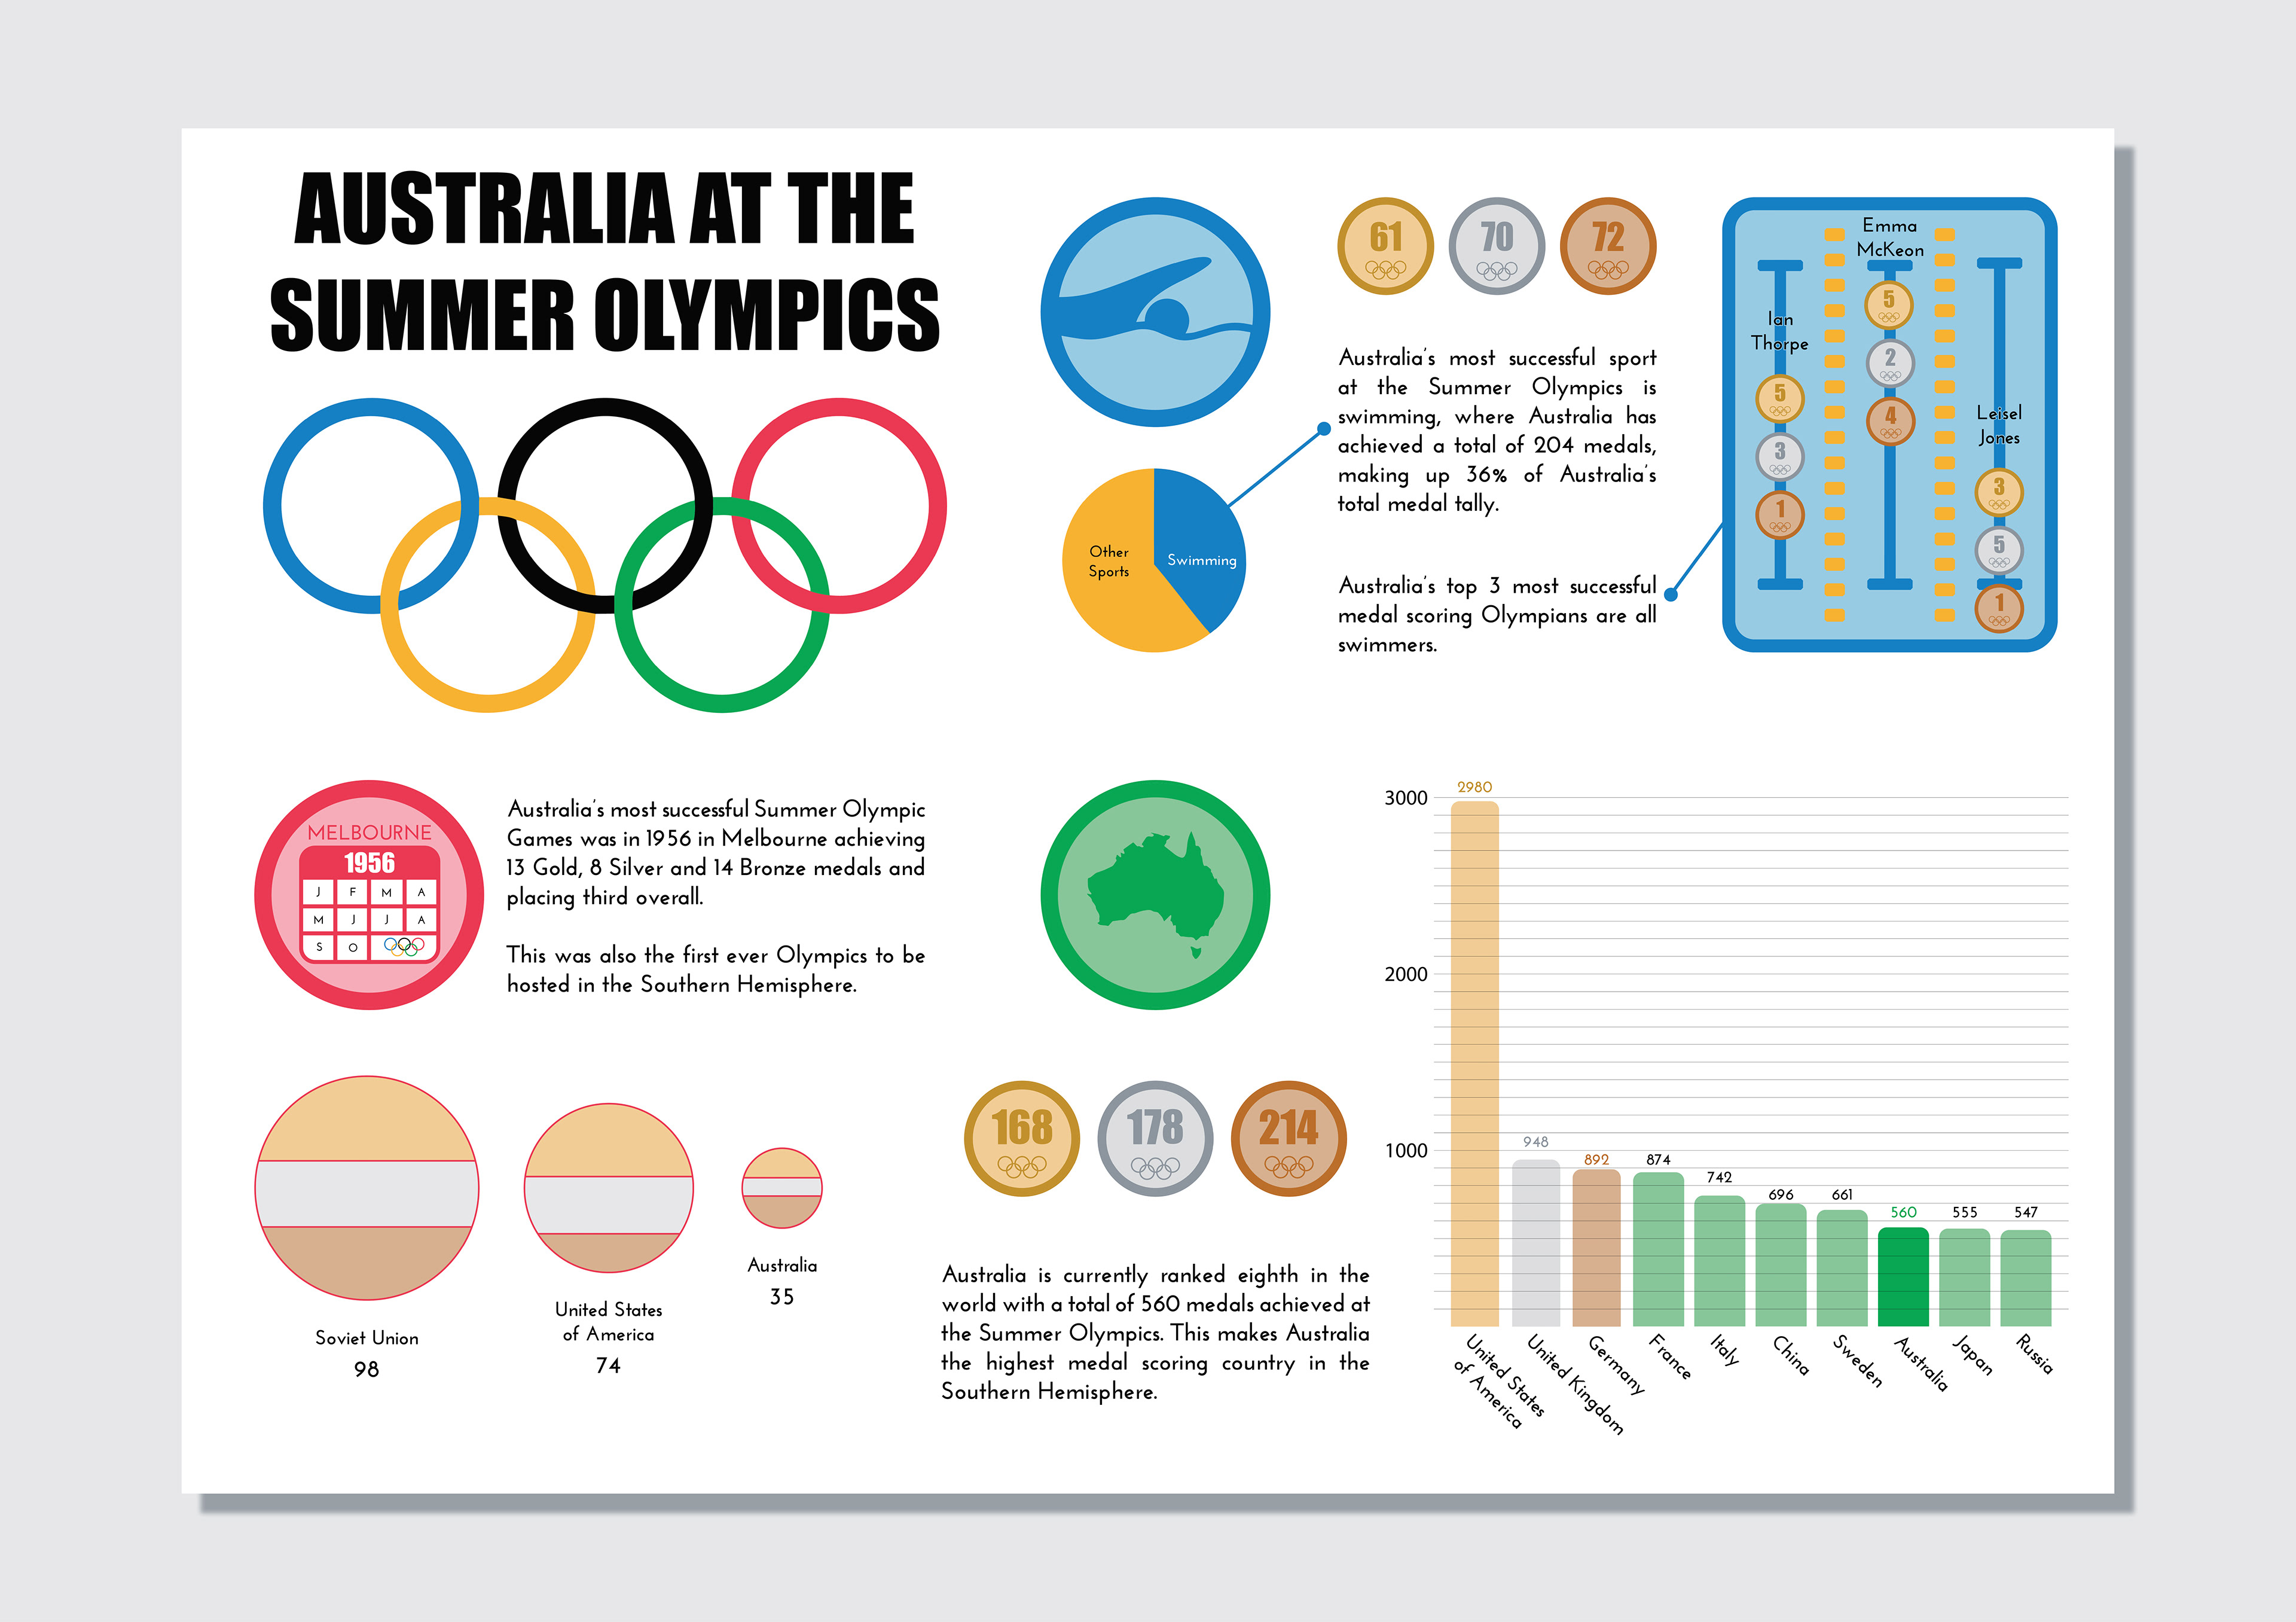
This Infographic shows Australia’s success across the Summer Olympic Games. It displays Australia’s standing worldwide, our most successful sport and finally our most successful Olympic Games (final standings, not highest medal tally).
Brief
To create an information visualisation in the form of a static information graphic.
Process
After receiving the brief for this project, I first picked my topic for the information visualisation: Australian Olympic statistics. From then I put all of the data I accumulated into an Excel spreadsheet to start narrowing down the types of data I wanted to use. I then sketched a few versions onto paper to work out the layout I wanted. I used Illustrator to create icons and graphs, which were finally put into InDesign to create the finished product.